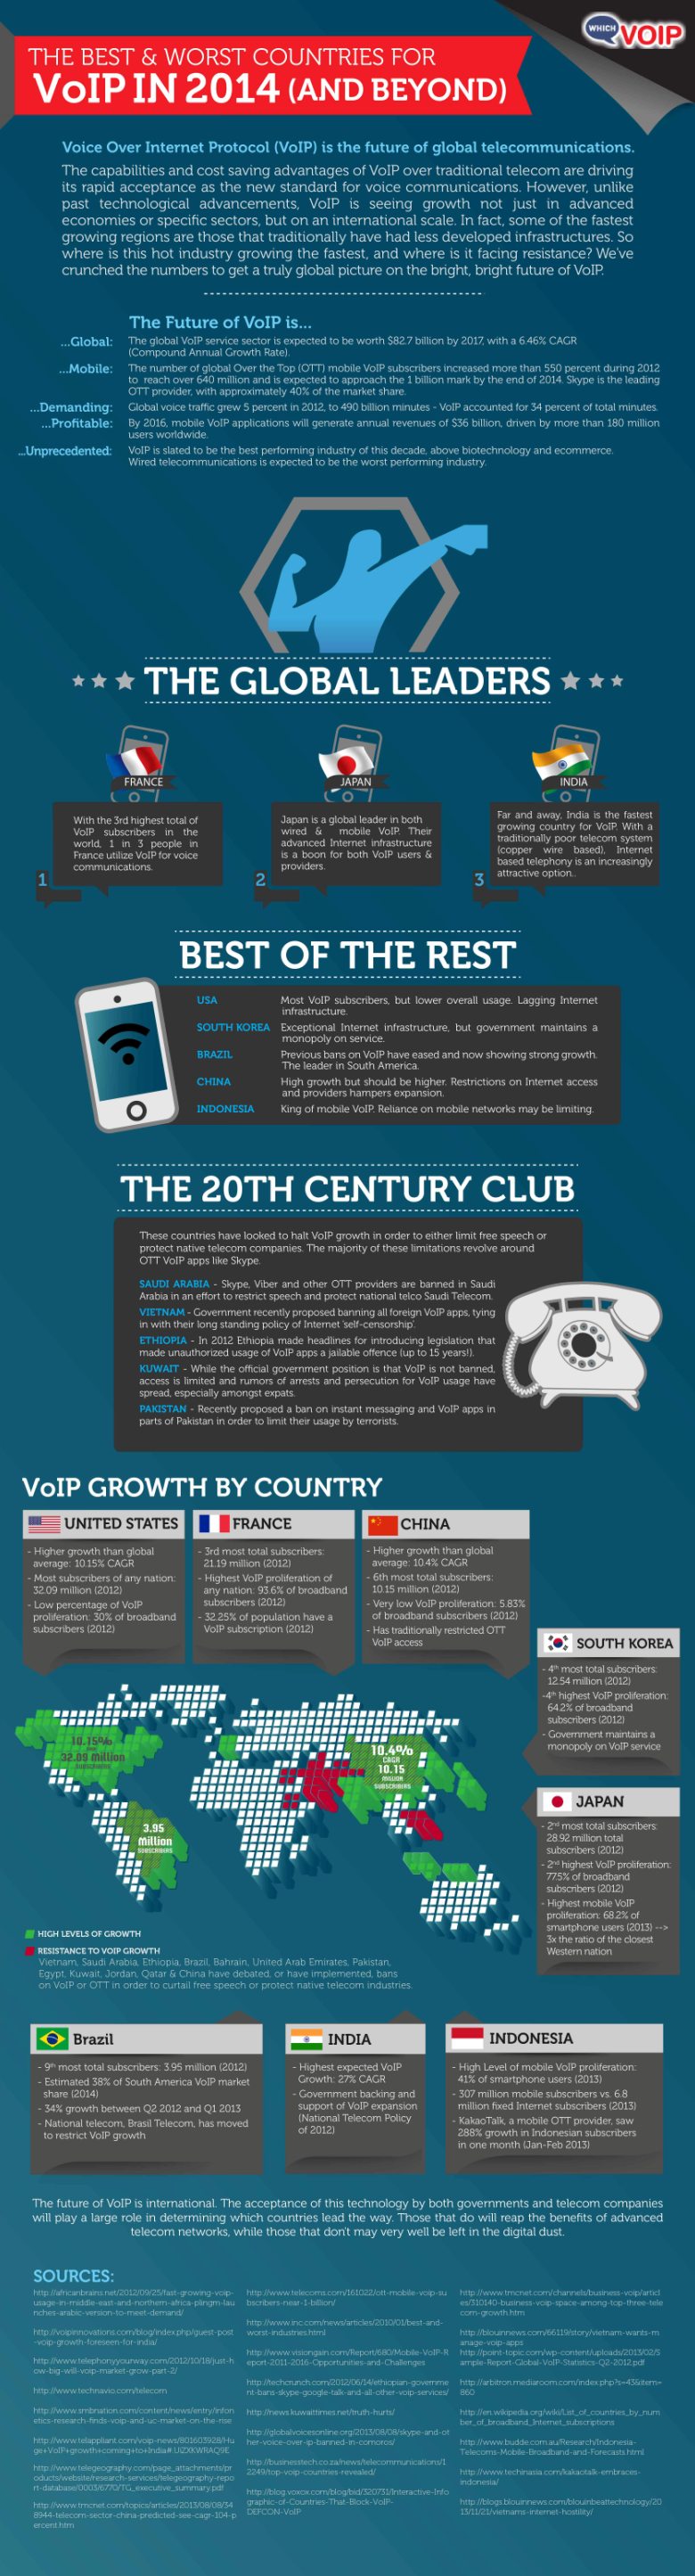
The capabilities and cost saving advantages of VoIP over traditional telecom are driving its rapid acceptance as the new standard for voice communications. However, unlike past technological advancements, VoIP is seeing growth not only in advanced economies or specific sectors, but on an international scale. In fact, some of the fastest growing regions are those that traditionally have had less developed infrastructures. So where is this hot industry growing the fastest, and where is it facing resistance? We have crunched the numbers to get a truly global picture of the bright future of VoIP.
If you would like to place this infographic onto your website then simply copy/paste the code below into your relevant page.
Current Trends and Forecasts
Here are some high level global VoIP trends in 2013 and forecasts of where VoIP is going in 2014:
- The Global VoIP service sector is expected to be worth $82.7 billion by 2017, with a 6.46% CAGR (Compound Annual Growth Rate).
- The number of global Over The Top (OTT) mobile VoIP subscribers increased more than 550 percent during 2012 to reach over 640 million and is expected to approach the 1 billion mark by the end of 2014. Skype is the leading OTT provider, with approximately 40% of the market share.
- Global voice traffic grew 5% in 2013 to 490 billion minutes. VoIP accounted for 34 percent of total minutes (approx 172 billion minutes).
- By 2016, mobile VoIP applications will generate annual revenues of $36 billion.
- VoIP is slated to be the best performing industry of this decade, above biotechnology and ecommerce. Wired telecommunications is expected to be the worst performing industry.
VoIP Trends and Profiles by Country
United States
- Higher growth than global average (10.15% CAGR).
- Most subscribers of any nation with 32.09 million in 2012.
- Low percentage of VoIP proliferation with only 30% of broadband subscribers in 2012.
France
- Third most total subscribers at 21.19 million in 2012.
- Highest VoIP proliferation of any nation with 93.6% of broadband subscribers in 2012.
- 32.25% of the population have a VoIP subscription in 2012.
China
- Fourth most total subscribers at 12.54 million in 2012.
- Fourth highest VoIP proliferation at 64.2% of broadband subscribers (2012).
- Government maintains a monopoly on VoIP service.
Japan
- Second most total subscribers with 28.92 million in 2012.
- Second highest VoIP proliferation with 77.5% of broadband subscribers (2012).
- Highest mobile VoIP proliferation with 68.2% of smartphone users in 2013. That is three times the ratio of the closest Western nation.
Indonesia
- High level of mobile VoIP proliferation with 41% of smartphone users in 2013.
- 307 million mobile subscribers versus 6.8 million fixed Internet subscribers in 2013.
- KakaoTalk, a mobile OTT provider, saw 288% growth in Indonesia subscribers in one month (Jan to Feb 2013).
India
- Highest expected VoIP growth at 27% CAGR.
- Government backing and support of VoIP expansion (National Telecom Policy of 2012).
Brazil
- Ninth most total subscribers with 3.95 million in 2012.
- Estimated 38% of South America VoIP market share by 2014.
- 34% growth between Q2 2012 and Q1 2013.
- National telecom, Brasil Telecom, have moved to restrict VoIP growth.
Resistance to VoIP Growth
The following countries have debated, or have implemented, bans on VoIP or OTT in order to curtail free speech or protect native telecom industries:
- Vietnam
- Saudi Arabia
- Ethiopia
- Brazil
- Bahrain
- United Arab Emirates (UAE)
- Pakistan
- Egypt
- Kuwait
- Jordan
- Qatar
- China
Conclusion
The future of VoIP is international. As growth continues the acceptance and promotion of VoIP technologies by both governments and telecom companies, will play a major role in determining which countries and regions will lead the revolution, reaping the benefits of advanced telecom networks, and which will be left in the digital dust.